|
Peano
|
|
Peano
|
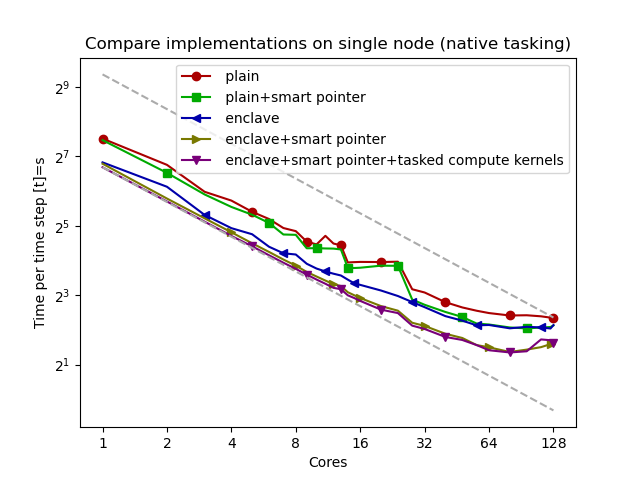
ExaHyPE comes along with a set of Python scripts to analyse the code's runtime behaviour. These tools can be found in the namespace exahype2.postprocessing. The core ingredient in there is a parser which analyses the standard outputs of ExaHyPE. Once you pipe the standard outputs into a file, you can apply these parser, i.e. use them within your own postprocessing scripts. There are however also a couple of command line tools which help you to explore the data. These tools use the same parsers, i.e. are a good starting point to familiarise yourself with the parser utilities.
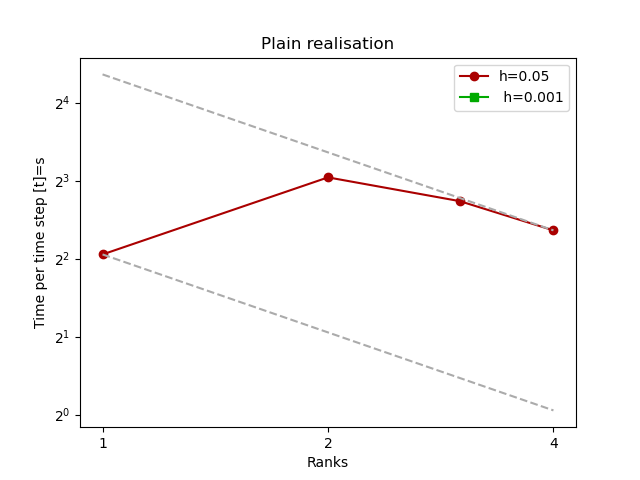
The script exahype2.postprocessing.plot-scaling.py provides a quick way to inspect archives which hold multiple text outputs using different ranks or cores. The invocation looks similar to
python3 $PYTHONPATH/exahype2/postprocessing/plot-scaling.py –log-x –log-y –output mpi-fv-legacy –label "h=0.05, h=0.001" mpi/results-fv-legacy-0.05.tar.gz mpi/results-fv-legacy-0.001.tar.gz –title "Plain realisation"
but it is better to call the script with –help for an overview of all options. The data is presented via matplotlib as standard speedup or efficiency graphs.
After each and every grid sweep, ExaHyPE dumps data to the terminal. If you don't filter it out, you get, for example, information about the runtime, the time step sizes, and so forth. These data can be postprocessed via exahype2.postprocessing.plot-runtime-behaviour.py
As ExaHyPE 2 is built on top of Peano 4, all the generic Peano scripts and Peano's statistics work for ExaHyPE, too.